IoT Project: Advanced Garden Monitor →
For my capstone project, I built a system of sensors and software to monitor the environment of a plant enclosure. Below is the final report. My original intention was to do a multi-part series of posts describing the process from prototyping, to the final deliverables, however I was unable to find time between graduating, moving out, and looking for a new job.
Further, this reports standards and procedures were copied nearly verbatim at the time of creation. Even as I copied over the sections from the Word doc, I noticed many areas of improvement in how the problems were approached, and solutions performed. As such, given the same problem space, the methods and procedures of finding, documenting, and implementing a solution would be improved if carried out today.
Prelude
The capstone project at Salem State is divided into two stages: first the proposal, then the final project. Each are taken as a semester-long, directed study. The report below reflects such structure.
Table of Contents
Original Proposal
April 25, 2019 CSC 521 Capstone Final
To build a robust prototype that monitors a plant’s environment and performs data-driven decisions to most optimally grow the plant
- RESTful API built using Java Spring framework
- API Authentication
- Front end data explorer (view graphs, data points, trends, etc)
Problem Specification
Plant Requirements
- Temperature/humidity
- Soil Moisture
- Nutrient uptake
How are these variables typically monitored?
- Manual monitoring with few data points
- No tracking of variables across time
- Manual record keeping
- Unable to see red flags early in plant’s life cycle
Solution
Overview
Continuous Monitoring System
- Sensors track environment continuously
- System will detect when environment variables fall outside optimal range nearly instantly
- Users can view and explore data, and trends, graphically on mobile or desktop
- Automated, configurable alerts to user
- Historical record of previous grows
- (with more data) can show dollar amount saved
Tool List
Hardware
- Raspberry Pi B+
- DHT 22 temperature/humidity sensor
- Soil moisture sensor
- Soil temperature sensor
- Wires and resistors
- Soldering iron
Software and Development Enviornments
- Vim
- Git
- VSCode
Computer Languages
- Python
- Bash
- HTML/CSS
- JavaScript
- SQL
API Specifications
- RESTful API Principles
- Authentication Method: API Keys
Libraries and Frameworks
Frontend
- Vue.js
- jQuery
- Chartist.js
Raspberry Pi Sensor Controller
- Requests
- Json
- Adafruit_DHT
Backend (Node.js)
- express
- http
- fs
- body-parser
- mysql
- sequalize
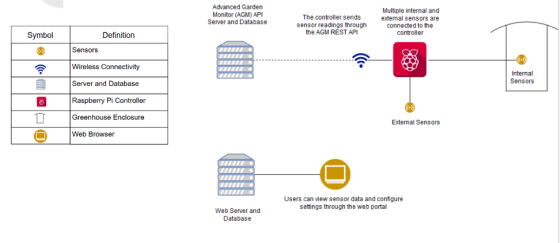
Solution Design Diagram
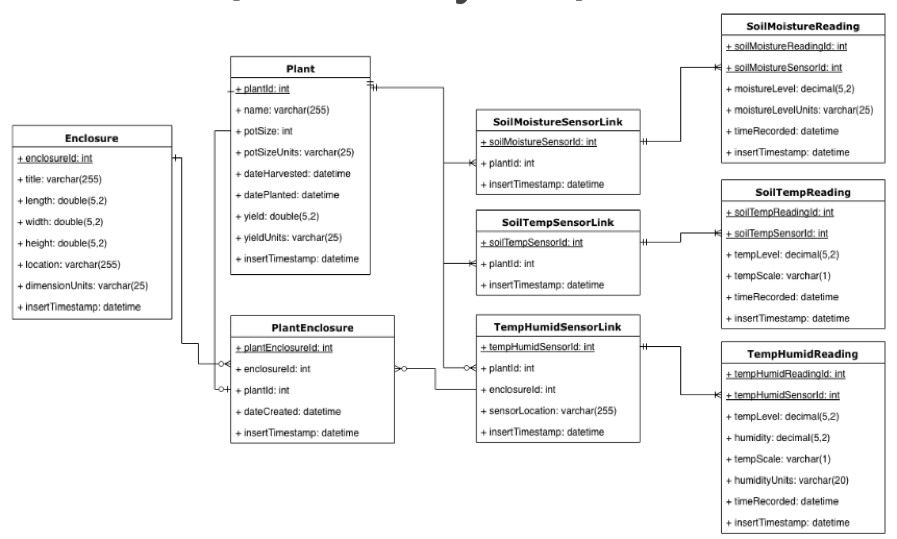
Entity Relation Diagram (Preliminary)
RESTful API Documentation
https://colbyleclerc.github.io/slate/#introduction
Benchmark Specifications
- Sensor controller completed
- ERD for sensors
- REST endpoints for sensors
- API Authentication implemented
- ERD for user management system
- User login system for frontend
- Frontend user dashboard
- Frontend data explorer
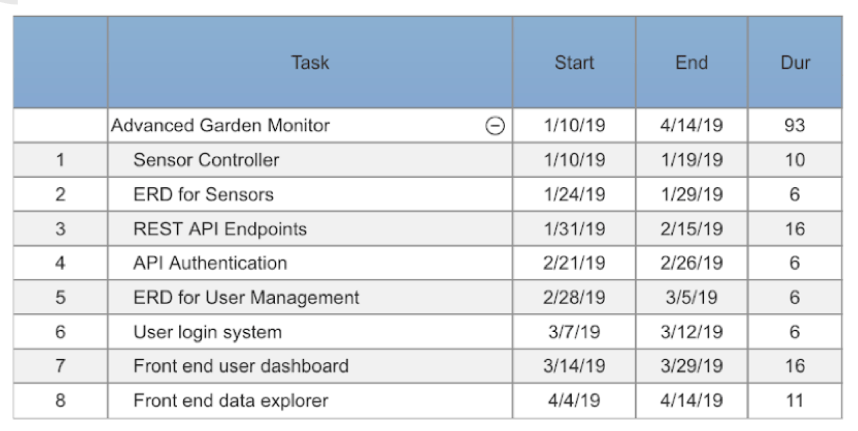
Time Schedule
Grading Scheme
| Description | Weight (%) |
|---|---|
| Final Presentation | 10 |
| Front end user management | 10 |
| Sensor Controller | 10 |
| Sensor REST API with Authentication | 35 |
| Front end user dashboard | 15 |
| Front end data explorer | 20 |
Deliverables
- Original project proposal documents
- Amendments to the proposal
- Appropriately commented source code
- Documentation of project functionality
- Sample output
- Project folder/executables
- Presentation documents
- Project journal – narration
- Project postmortem
- Which areas of the project were not completed
- Sensor controller hardware system
Final Project
Tool List
Hardware
- Original: Soil moisture, soil temperature, temperature/humidity
- Amended: Temperature Humidity
- Rationale: The setup for the Temperature Humidity sensor was rather straightforward, as it came with its own library to read the sensor data from. The Soil Moisture and Soil Temperature sensors required more low-level tuning and configuration, of which I was unable to get a correct reading from preforming the calibration tests. Given the time allotted for sensor configuration, I ran over the predicted time unit, and determined I had higher priority matters to work on. Getting at least one sensor configured (The temperature-humidity sensor) allowed me to generate enough test data for the purpose of this project.
Algorithms and Data structures
- Original: Sensor caching system
- Amended: No caching system
- Rationale: After going over the time unit laid out for sensor configuration, it was apparent that the extra time had to come from another milestone, namely the caching system. My hope was to forego the caching implementation for additional sensors, however neither of these objectives were met.
Front-end
- Original: Vue.js with Chartist.js
- Amended: Webpack with Chart.js
-
Rationale: Once the time came to work on the front end, I hadn’t realized the learning curve needed to use Vue.js. My experience was more with ‘raw’ JavaScript, HTML, and CSS. Thus I decided to take a WebPack template, and modify it accordingly to meet the specifications needed for the front-end. This allowed me to easily compile changes, target multiple browsers, and still use ‘raw’ JavaScript without the need to learn an entire framework, such as Vue.js.
- Original: Login UI
- Amended: No login UI, but authentication still designed
- Rationale: At work we began to investigate using Java Spring Boot with Hibernate ORM, and after spending time learning this framework, it made much more sense to use this as compared to Node.Js. I’ve built applications with Node, however my knowledge of Java exceeds JavaScript, and given that my ‘working memory’ was involved with Java Spring at work, it made more sense to use this framework as opposed to context-switching each day I worked on the project. Furthermore, Hibernate ORM was meshed coherently with Spring such that integration of the two was seamless, allowing me to spend more time on the business logic of the application, instead of configuring the connection pool as needed with Node.js
Back-end
- Original: Node.js with Express
- Amended: Java Spring Boot with Hibernate ORM
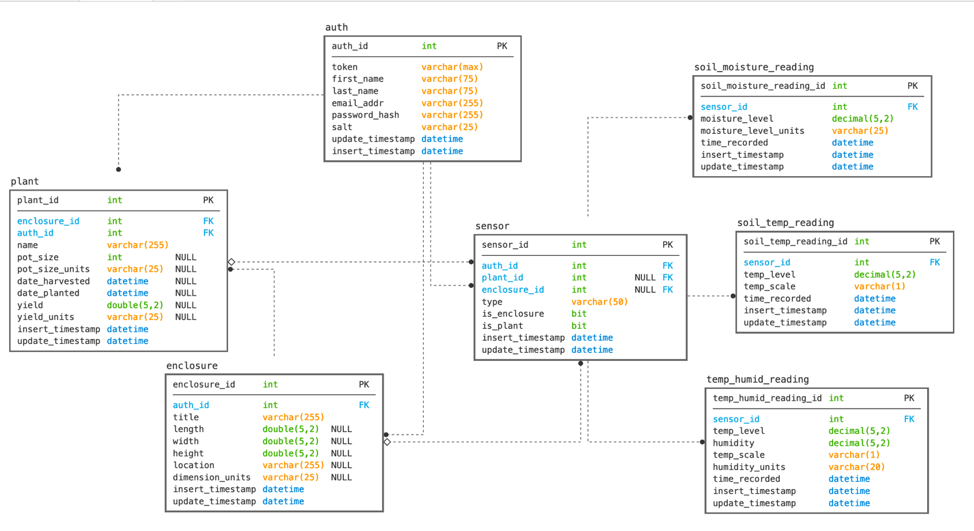
Entity Relation Diagram
Rationale for changes
After designing the authentication system, it was quickly evident that a subsystem laid on top of the original ERD was not going to be maintainable, and thus I decided to ‘cut my losses’ and redesign a majority of the system. The new ERD still allows for new sensors to be added to the system with relative ease, while also reducing unnecessary duplication of data (better normal form). The most significant change seen is the addition of the ‘auth_id’ to each table, besides the reading tables. This allows us to associate each record with the authenticated, and authorized, user. Note the reading tables do not have an ‘auth_id’: this is because a reading will not be able to be added unless the sensor exists, and the passed authentication token relates correctly to the sensor. Thus, a reading must have an existing sensor, and said user must be authorized to modify the passed sensor.
Changes to time schedule
- Sensor controller completed (Raspberry Pi configured to read sensor data, send requests to the REST API, and caching system designed and implemented) – 2 weeks
- As mentioned above, time was taken away from the caching system implementation in an attempt to configure the other two sensors. Thus the caching system will not be delivered.
- ERD for sensors implemented – 1 week
- This took about a week longer due to the redesign, however this allowed for a better foundation for the entire project, and allowed authentication and authorization to exist within the system
- REST endpoints for sensors implemented – 3 weeks
- This took about 2 weeks longer than expected, due to the framework change and some road bumps along the way that are outlined in the project narrative document.
- API Authentication designed and implemented -1 week
- The API Authentication system was designed and implemented from the backend, allowing for REST calls to be performed securely.
- ERD for user management system designed and implemented – 1 week
- This is combined with the Authentication system mentioned above. Notably, the user info present within the auth table.
- User login system for frontend – 1 week
- I was not able to complete this in the time provided, as integration between the front-end and back-end took longer than expected. However, the backend has the appropriate data storage for such a feature, which I would argue is the bulk of the work for a user login system. The only thing required is the front-end UI for signing up, and signing in.
- Front end user dashboard (to configure sensors, plants, enclosures) – 3 weeks
- The front-end contains three main pages: the dashboard, the enclosure details, and the forms:
- Dashboard: This page contains a list of each enclosure associated with the authenticated user. Each record in the table contains the title of the enclosure, the location, and the number of plants within the enclosure. Clicking an enclosure within the data table takes the user to the enclosure details page.
- Enclosure details: This page lays out a graph for each applicable sensor within the enclosure. The graph allows the user to view the trend of the sensor data, as well as view individual data points and their values.
- Forms: This page has multiple functions. The page is laid out in tiles, with each enclosure having it’s own tile. Each enclosure tile lists out the sensors associated with the enclosure (both plant sensors, and enclosure sensors). Other tiles include a plant tile that lists out each plant, it’s associated enclosure, and the name of the plant. Each plant listed, as well as each sensor listed, can be deleted from this page. Furthermore, there exist three tiles for creating a sensor, a plant, and an enclosure with the appropriate parameters. The forms perform validation, and alert the user if any input is incorrect. After calls are made to the backend, the page is reloaded to view the changes
- Front end data explorer (to view sensor data as graphs, export as csv, etc) – 2 weeks
- See above for explication of front-end
- The front-end contains three main pages: the dashboard, the enclosure details, and the forms:
Conclusion
About half-way into the capstone project, I realized rather suddenly that my strengths are in backend systems, to say the least. If I had scoped the project out such that the front end was not a deliverable, but only the backend and sensor configuration was needed, I believe I could have been more successful and had more time to add more features. The bulk of the overage in time was spent on front end configuration and building. Further, given enough time I could have integrated the soil moisture and soil temperature sensors into the project, and built out the caching system (which I really wanted to work on, however the time constraints did not allow for it). The only issue with an only back-end system is the presentation of it to a broader audience — how do you convey the work and architecture of a system to an audience without a front-end UI? Sure diagrams and statistics would be a great start, however during the proposal I felt that a front-end UI was necessary for the goals of the capstone project. If it’s any solace to perspective users of AGM, the front-end will be rewritten using a more robust framework (such as Vue.js or React.js), and by someone who knows the front-end stack far better than myself.
Postmortem
I began the project by working on the sensor controller. Before capstone, I had created a rough prototype that used an older version of the DHT temperature-humidity sensor mentioned in my project outline. The initial prototype was able to send out basic REST requests whose payload contained the temperature and humidity data. Working off this as my starting point, I implemented and tested the new version of the DHT sensor, the DHT 22 sensor, with success. Next, I was to configure the soil moisture and soil temperature sensors, however I ran into some difficulty. Namely, the configuration of the sensor was not nearly as straightforward as the DHT sensor, as the DHT sensor had a prebuilt library associated with it. After going over my planned time commitment, I was still unable to configure the second and third sensor. Seeing that I had higher priority parts of the project to work on, I decided to move on and come back to the sensor configuration, if time permitted. Further, I had to forego the sensor caching system, to buy more time for sensor configuration. The more important part was that I had at least one functioning sensor to grab testing data from.
Next was the ERD for the sensors. This was already created during my proposal, however as mentioned in the amendment document, the design underwent a more radical redesign than anticipated. I had planned to design the ERD for the user management system further into the project timeline, however that did not make sense to me, since that meant building the endpoints before the authentication and authorization system was created. Thus, I decided to design the user management system at this time unit. After laying out the requirements, it was evident rather quickly that adding such a subsystem on top of the existing ERD would make the entire system more difficult to build, maintain, and extend. Seeing this issue, I decided to redesign both diagrams, essentially combining the two into one diagram, while accomplishing the requirements necessary for the original diagram (namely the ability for new sensors to, with relative ease, be added to the system). The end result was a more robust system, with less data duplication (in regards to the bridge tables seen in the proposal). By duplicating the ‘auth_id’ across multiple tables, we are able to store and retrieve records from each table without unnecessary joins (note some joins were still necessary). Further, the system is overall more secure as compared to the alternate system, which involved the user management system being separate from the core system.
The REST endpoints are the bulk of the project, which was rather straightforward. In the beginning, I initially planned to use Node.Js with Express and other libraries to create the API, however at the same time I was investigating the Java Spring family of frameworks at my job. I decided to change the API language and tools from JavaScript with Node.Js to Java with Spring Boot. This was done for multiple reasons: Most importantly, I would not have to context switch between Java with Spring at work, then JavaScript with Node at home. This made me more efficient when building out the API. Further, my experience with Java spans to when I was fourteen, thus my knowledge of Java far exceeds Node.js (note Note.js is a runtime environment, thus Node has its own nuances beyond that of JavaScript that must be learned. Thus, its more involved than learning just a framework). From a requirements perspective, both Node.Js and Java Spring satisfy the requirements necessary for the project. Further, both are relevant in the industry, and are used by major technology companies for high-throughput, high-availability solutions. Thus, I was able to make a subjective decision, as opposed to an objective decision based off project requirements since these were adequately met.
API Authentication and ERD for User Management were the next two items on my timeline, both of which were mentioned earlier during the redesign of the ERD for the entire system. The Authentication method used involves tokens (not JWS Bearer tokens), in which a user account is assigned a private token that is used with each request. The token is used to associate the requests with the user’s account, and to ensure the user only accesses authorized records. In a production system, https would be enforced, meaning the token would be encrypted during transit. Further, an additional feature could be domain verification, in which only requests originating from a predefined domain would be allowed to access the API. This would be configured in the front-end UI by the user, with the requirement the domain provided had a valid SSL certificate (which thanks to Let’s Encrypt is now a free, straightforward process).
The user login system was put on hold, due to time constraints. Given the extra time spent on sensor configuration, and seeing the graded weights between the UI (dashboard and data explorer) and the user login system, I decided to pursue the UI first. As explained below, the UI had various issues during implementation and integration, thus I was unable to return to the user login system portion of the project. The backend system has been designed to allow for such a system, and is ready to be integrated with a front-end login system. Thus, I would argue a large portion of a login system involves the backend implementation, which is complete, thus the only portion missing is the UI of the login system. The front-end dashboard and data explorer took much longer than I had anticipated. Namely, I began the project by trying to learn Vue.js, of which was a steep learning curve for me, and took more time than I had planned. I decided to cut my losses, and change to using a Webpack template I found, and modifying the template for the project. This meant I could use ‘raw’ JavaScript, HTML, and CSS without worrying about the (essentially) sub-languages built into the Vue.js framework. The front-end consists of three main pages, the dashboard, the enclosure details, and the forms. The dashboard presents the user with a table containing a record of each enclosure. Clicking the record sends the user to the enclosure detail page, where a graph is displayed for each sensor associated with the enclosure (both enclosure sensors, as well as plant sensors). The enclosure detail page allows the user to view each graph, see the trends of the data, and view the discrete values of each data point. The form page has multiple functionalities. The page is broken up into tiles, with each enclosure associated with the user’s account having a tile generated. Each enclosure tile consists of all sensors (both plant and enclosure type) associated with the defined enclosure. Further, there exists a Plant tile that lists all plants and their associated enclosure. Finally, there exists three tiles for creating a new sensor, plant, and enclosure. Upon creation, the page reloads to show the change.